The California drought has received a significant amount of media coverage and I am seeing more frequent posts on the Texas drought as well. This made me wonder when was the last time California and Texas were not in a drought? Or rather, are California and Texas always in a drought? A review of the data on the United States Drought Monitor website indicates the two states are always in a drought (at least over the last 14 years). In fact, since January of 2000, there has never been a week where all of California and Texas were both completely drought-free. But first some context to understand why this question is so important.
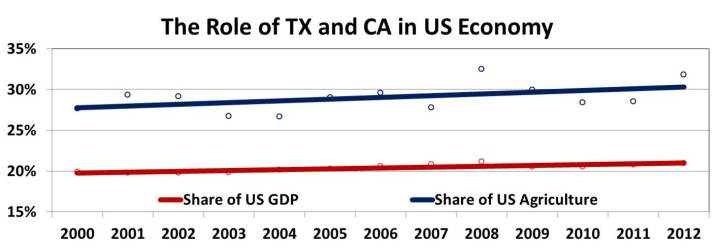
California and Texas are two of the largest states in the country. Combined, they represent roughly one-fifth of the country’s GDP. They account for an even larger proportion of the country’s agricultural economy where water is a critical resource. Both states also send an outsized proportion of water to agriculture – roughly 55-80% of the water in Texas and California flows to agricultural users. The following chart highlights that both states are also relatively arid. California receives an average of just over 22″ of rain each year and there is an average of 28″ in Texas.
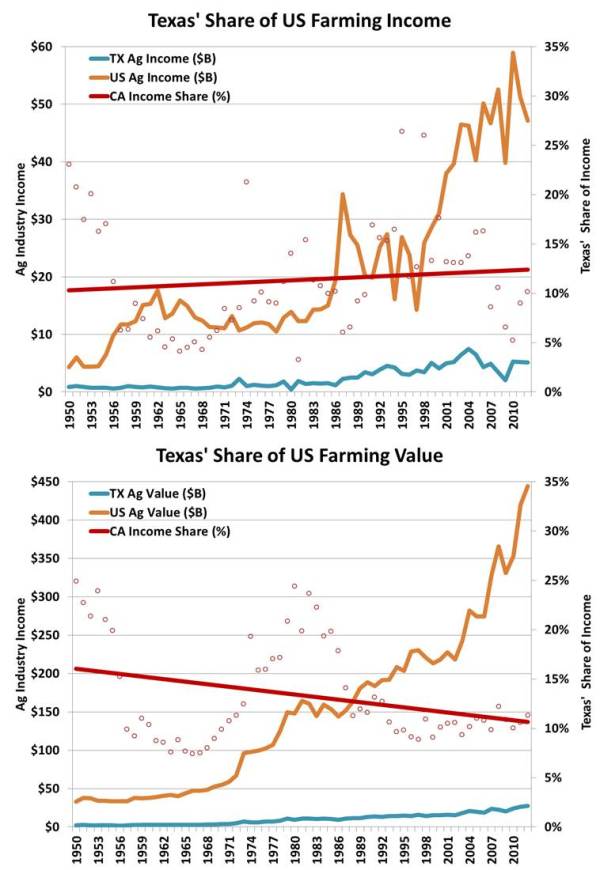
As highlighted in the following chart, California represents nearly 20% of the value of the country’s entire agriculture sector. California’s share of income generated from US agriculture is even more significant. California accounts for 25% of the sector’s income and that share has doubled since 1950.
Texas has accounted for roughly 10% of the country’s agriculture sector since the late 1980’s. The state also accounts for an equivalent share of the sector’s income.
While California and Texas’ role in the country’s agriculture economy has varied since the 1950’s it has been relatively stable for the last decade or two. As mentioned earlier and detailed below, the two states account for roughly 20% of the country’s GDP. But their portion of the US agricultural economy has steadily increased and is approaching one-third of the total value in the sector. So, California and Texas represent a much larger portion of the country’s agricultural sector than they do to the overall economy. In total, the agriculture sector in those two states was $75B in 2012 which resulted in over $20B in income. Given that the sector utilizes half to three quarters of the water in the state the impact of a drought occurring simultaneously in both of these states could be significant. 
Drought data and commentary on local, state, regional, and national conditions is readily available from the U.S. Drought Monitor. The Monitor was established in 1999 and offers a weekly update on drought conditions based on data and feedback from the National Oceanic and Atmospheric Administration, the U.S. Department of Agriculture, and the National Drought Mitigation Center (NDMC) at the University of Nebraska-Lincoln. The drought severity classifications range from D0, “abnormally dry”, to D4, “exceptional drought”. Details of those rankings, including their probability of occurrence, can be found here. Every week the Monitor updates maps and data sets to show where drought conditions are occurring and which amount of land area is experiencing various levels of drought severity (from D0-D4).
To complete this analysis, weekly data was collected from the Monitor for both California and Texas. Since Texas is geographically larger than California (approximately 269,000 square miles versus 164,000 square miles, respectively) the consolidated data was adjusted for the differing land areas of the two states. The following chart shows what percentage of the two, combined states are experiencing drought based on the drought classifications (rated D0-D4). As you can see, during a brief wet period in January and February of 2005 the two states almost achieved a week of no drought conditions. But over the last 14 years, roughly 55% of the two states are under some type of drought watch or warning. So, this data shows that yes, California and Texas are always in a drought. (It is also interesting to note that over the same 14 year period there have only been two weeks (in July, 2013) where the entirety of both states were in a drought. 
This data made me wonder how often both states experience “bad” droughts. The following chart shows that, on average, 25% of California and Texas experience a severe, extreme, or exceptional drought (a drought that has a probability of 1-in-10 or worse) during any given week. But the last few years have been particularly difficult. Since April, 2011 the average is nearly 50%. In hindsight, it is interesting to note the “bad” (<10% probability) drought conditions during the first half of last decade were relatively minor for Texas and California . The second half of last decade was more challenging for the two states. But the majority of this decade has been quite challenging.
So, as cliché as it sounds, we do need to act with a sense of urgency. Hopefully this data helps highlight yet another reason we need to share best practices and quickly address critical policy issues so that comprehensive solutions can be implemented. Given the arid environment, the amount of water used by agriculture, and the fact that the two states represent a third of the country’s entire sector (which amounted to $75B of economic value in 2012) it doesn’t appear things will be getting easier any time soon.
Sources:


